One of the Patient Protection and Affordable Care Act's central goals is to reduce the number of uninsured Americans. And while the uninsured rate has dropped to a record low of roughly 13.4 percent nationwide, according to Gallup numbers, rates vary dramatically across states.
Wallethub, a personal finance social network, analyzed data from the Kaiser Family Foundation, the Centers for Medicare and Medicaid Services, the Department of Health and Human Services and the U.S. Census Bureau to determine which states have the best uninsured rates following the implementation of PPACA.
"Following the implementation of Obamacare, there's been a lot of talk but not a lot of real information consumers can use to compare states by insurance coverage rates," the Wallethub report read.
Recommended For You
The data is an initial projection of uninsured rates post-PPACA for 43 states and the District of Columbia. Seven states were excluded from analysis due to data limitations, analysts said.
10. Kentucky
Pre-PPACA uninsured rate: 17.3 percent
Post-PPACA projected uninsured rate: 8.95 percent
Difference before and after: -8.35 percent
9. Washington
Pre-PPACA uninsured rate: 16.01 percent
Post-PPACA projected uninsured rate: 8.27 percent
Difference before and after: -7.73 percent

8. Iowa
Pre-PPACA uninsured rate: 11.58 percent
Post-PPACA projected uninsured rate: 7.47 percent
Difference before and after: -4.11 percent
7. Minnesota
Pre-PPACA uninsured rate: 10.07 percent
Post-PPACA projected uninsured rate: 6.61 percent
Difference before and after: -3.47 percent
Photo: Iowa's state capitol building in Des Moines. Getty Images.

6. West Virginia
Pre-PPACA uninsured rate: 17.34 percent
Post-PPACA projected uninsured rate: 6.59 percent
Difference before and after: -10.74 percent
5. Oregon
Pre-PPACA uninsured rate: 16.91 percent
Post-PPACA projected uninsured rate: 6.38 percent
Difference before and after: -10.54 percent
Photo: Portland, Oregon. Getty Images.

4. Hawaii
Pre-PPACA uninsured rate: 9.11 percent
Post-PPACA projected uninsured rate: 6.35 percent
Difference before and after: -2.75 percent
3. District of Columbia
Pre-PPACA uninsured rate: 9.09 percent
Post-PPACA projected uninsured rate: 6.29 percent
Difference before and after: -2.80 percent
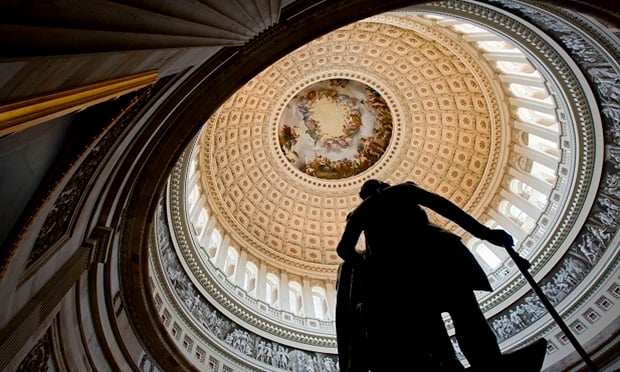
Photo: Associated Press/Ronen Zilberman

2. Rhode Island
Pre-PPACA uninsured rate: 14.34 percent
Post-PPACA projected uninsured rate: 5.6 percent
Difference before and after: -8.73 percent
1. Massachusetts
Pre-PPACA uninsured rate: 4.35 percent
Post-PPACA projected uninsured rate: 1.2 percent
Difference before and after: -3.16 percent
Photo: Boston
© 2025 ALM Global, LLC, All Rights Reserved. Request academic re-use from www.copyright.com. All other uses, submit a request to [email protected]. For more information visit Asset & Logo Licensing.


