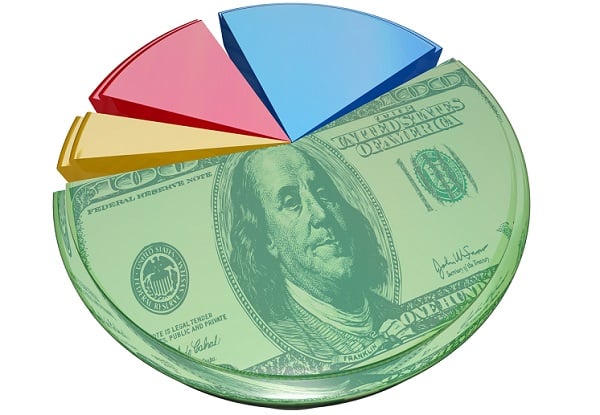
 The latest report on health care payments shows “additional opportunities to increase payments through episode- and population-based payments that have additional risk.” (Image: Shutterstock)
According to a report from the Learning & Action Network, launched in March of 2015 by the U.S. Department of Health and Human Services, health care payments tied to alternative payment models—shared savings, shared risk, bundled payments and population-based payments—have risen at a steady pace from 23 percent over a two-year span to 34 percent of total U.S. health care payments in 2017.
High-level findings from the report indicate the breakdown of health care dollars within the four categories of the LAN's Refreshed APM Framework, with 41 percent of health care dollars in Category 1 (Fee-for-Service—No Link to Quality & Value); 25 percent in Category 2 (Fee-for-Service—Link to Quality & Value); and 34 percent in Categories 3 (APMs Built on Fee-for-Service Architecture) and 4 (Population-Based Payment).
Recommended For You
Complete your profile to continue reading and get FREE access to BenefitsPRO, part of your ALM digital membership.
Your access to unlimited BenefitsPRO content isn’t changing.
Once you are an ALM digital member, you’ll receive:
- Breaking benefits news and analysis, on-site and via our newsletters and custom alerts
- Educational webcasts, white papers, and ebooks from industry thought leaders
- Critical converage of the property casualty insurance and financial advisory markets on our other ALM sites, PropertyCasualty360 and ThinkAdvisor
Already have an account? Sign In Now
© 2025 ALM Global, LLC, All Rights Reserved. Request academic re-use from www.copyright.com. All other uses, submit a request to [email protected]. For more information visit Asset & Logo Licensing.


