 (Credit: CDC)
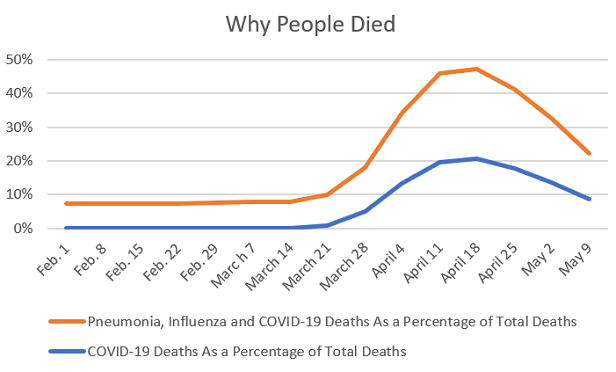
New death numbers from the U.S. Centers for Disease Control and Prevention (CDC) suggest that the percentage of all U.S. deaths caused by COVID-19 is continuing to fall.
The CDC's latest weekly COVID-19 tracking report — which is based on state figures for deaths recorded by May 9 — show that confirmed cases of COVID-19 were responsible for 9% of the 26,479 deaths reported for the latest week, down from 14% in the week ending May 2.
Resources
- The CDC's weekly COVID-19 report is available here.
- The CDC's provisional COVID-19 mortality data table is available here.
Getting tested for severe acute respiratory syndrome coronavirus 2 (SARS-CoV-2), the virus that causes COVID-19, is notoriously difficult.
The CDC tries to get around that problem by tracking figures for potential COVID-19 look-alike illnesses — influenza, pneumonia and "influenza-like" illnesses. It also tracks the number of deaths from all causes.
Many states send death data to the CDC a few weeks later than others. For the week ending April 25, for example, the total number of deaths recorded for the week in the new COVID-19 report is about 20% higher than the number for the week for April 25 given in last week's report.
Another factor that could, possibly, be throwing off the numbers is political pressure. Critics of efforts to ease COVID-19-related quarantine rules in states such as Florida and Texas have accused government officials of hiding or distorting outbreak-related statistics.
The ratio of COVID-19, flu, pneumonia and flu-like deaths to total deaths might be an indicator that compensates for the data reporting lag and for the COVID-19 testing problems.
COVID-19 and COVID-19 look-alike conditions accounted for 14% of U.S. deaths in the week ending May 9, according to the new CDC death table. That's down from 19% in the week ending May 2.
New York City reports its own death numbers to the CDC, as if it were a state. The city is known for having a severe COVID-19 outbreak and relatively easy access to COVID-19 testing.
In New York City, the CDC figures show that confirmed COVID-19 cases have accounted for more than 90% of the deaths caused by COVID-19 and COVID-19 look-alike conditions since the week ending April 11. In other words: the COVID-19 death numbers there look similar to the death numbers for all conditions that look like COVID-19.
In New York City, the percentage of total deaths caused by COVID-19 fell to 39% in the week ending May 9, from 50% in the week ending May 2.
The percentage of total deaths caused by COVID-19 and COVID-19 look-alikes fell to 43%, fro 54%.
For a chart showing how the percentage of all deaths caused by COVID-19, and the percentage of all deaths caused by conditions that seem as if they could be COVID-19, have changed over time, look above.
For weekly death numbers, see the chart below.
We'lll be publishing a more complete account of the data, including state-by-state numbers, Monday.
.
| DAta for the week ending | COVID-19 Deaths | Pneumonia, Influenza and COVID-19 Deaths | Total Deaths | COVID-19 Deaths As a Percentage of Total Deaths | Pneumonia, Influenza and COVID-19 Deaths As a Percentage of Total Deaths |
|---|---|---|---|---|---|
| Feb. 1 | 0 | 4,177 | 57,535 | 0% | 7% |
| Feb. 8 | 1 | 4,210 | 58,140 | 0% | 7% |
| Feb. 15 | 0 | 4,269 | 57,480 | 0% | 7% |
| Feb. 22 | 2 | 4,157 | 57,510 | 0% | 7% |
| Feb. 29 | 7 | 4,341 | 57,784 | 0% | 8% |
| March 7 | 32 | 4,419 | 57,373 | 0% | 8% |
| March 14 | 51 | 4,403 | 55,856 | 0% | 8% |
| March 21 | 517 | 5,083 | 55,965 | 1% | 9% |
| March 28 | 2,897 | 7,758 | 59,074 | 5% | 13% |
| April 4 | 8,893 | 14,066 | 66,978 | 13% | 21% |
| April 11 | 14,287 | 19,018 | 72,459 | 20% | 26% |
| April 18 | 14,077 | 17,954 | 68,029 | 21% | 26% |
| April 25 | 10,760 | 14,045 | 60,216 | 18% | 23% |
| May 2 | 6,464 | 8,889 | 47,070 | 14% | 19% |
| May 9 | 2,311 | 3,581 | 26,479 | 9% | 14% |
Recommended For You
© 2025 ALM Global, LLC, All Rights Reserved. Request academic re-use from www.copyright.com. All other uses, submit a request to [email protected]. For more information visit Asset & Logo Licensing.


